Planning estimate. Get more accurate rent

Seattle-area home prices down 8–20% from peak
The True Cost of
Selling Your Home
in 2026
Most homeowners only consider agent commissions. The real cost includes market timing losses, excise taxes, closing fees, and more. Enter your property details to see the full picture.
- Based on real Seattle-area market data (Redfin, Q1 2026)

Would You Sell Your Stocks After a 15% Crash?
If you invest in the stock market, you already know the golden rule: don’t sell when the market is down. It sounds obvious, yet study after study shows that the single biggest mistake investors make is panic-selling during a correction—locking in losses right before the recovery.
8 months
Average recovery time from a 10–20% stock market correction
24 corrections
Best market days in 30 years happened during the 3 worst crashes
100 %
The S&P 500 has historically recouped its losses after 24 corrections since World War II
Dalbar’s research consistently finds that investors who stay the course outperform those who try to time the market—often by a wide margin. The reason is simple: time in the market beats timing the market.
Real Estate Works Exactly The Same Way.
Right now, the Seattle-area housing market is in a correction. Selling your home today is the equivalent of selling your stock portfolio after a 15% drop—you’re locking in the loss at the worst possible moment, and you’re paying a massive “exit fee” (commissions, taxes, closing costs) on top of it.
Market Data Comparison
| Area | Early 2025 | Early 2026 | Change |
|---|---|---|---|
| Bothell (98011) | $1,175,000 | $998,000 | −15.1% |
| Kirkland (98034) | $1,134,000 | $950,000 | −16.2% |
| Bellevue Lake Hills (98008) | $1,413,000 | $1,200,000 | −15.1% |
| Seattle Madison Park (98112) | $1,493,000 | $1,200,000 | −19.6% |
| Seattle Beacon Hill (98144) | $761,000 | $632,000 | −16.9% |
| Seattle U-District (98105) | $1,265,000 | $1,100,000 | −13.0% |
Why This Matters
- Selling now locks in a 15–20% loss at the worst possible time
- You’ll pay 5–6% in commissions on top of the market loss
- Plus taxes, closing costs, and preparation expenses
The Alternative
- Rent your property and earn monthly income
- Wait for the market to recover as it always does
- Sell when prices rebound—avoiding the loss entirely
Homeowners who can hold through a correction may be better positioned to benefit from a future recovery—just as long-term investors can benefit by avoiding panic-driven decisions. The important question is whether selling now or renting and waiting better supports your financial situation, property goals, and timeline.
See What Your Home Could Cost to Sell
Based on average home values in your ZIP code
Enter Your Property Details
Enter your property's peak and current values to calculate the true cost of selling.
$
$
$
$
$ Transaction Costs
0%7%
0%3%
$
$
$
✓
The Smarter Alternative: Rent & Wait
Just like you wouldn't sell stocks after a crash, consider renting your property while evaluating the right time to sell.
By renting instead of selling immediately, you could receive approximately $0 per year in gross rental income while avoiding an estimated $0 in immediate selling expenses.
- Difference from previous peak
- $0
- Agent commission
- $0
- WA excise tax
- $0
- Other selling expenses
- $0
- Total transaction costs
- $0
- Estimated proceeds before mortgage
- $0
- Estimated proceeds after mortgage
- $0
Estimates are for educational and planning purposes only. Actual values, taxes, commissions, expenses, rent, and proceeds may vary. This calculator does not provide financial, tax, or legal advice.
Get Your Free Rental Analysis
See detailed market insights for your property
Example Rental Analysis Report
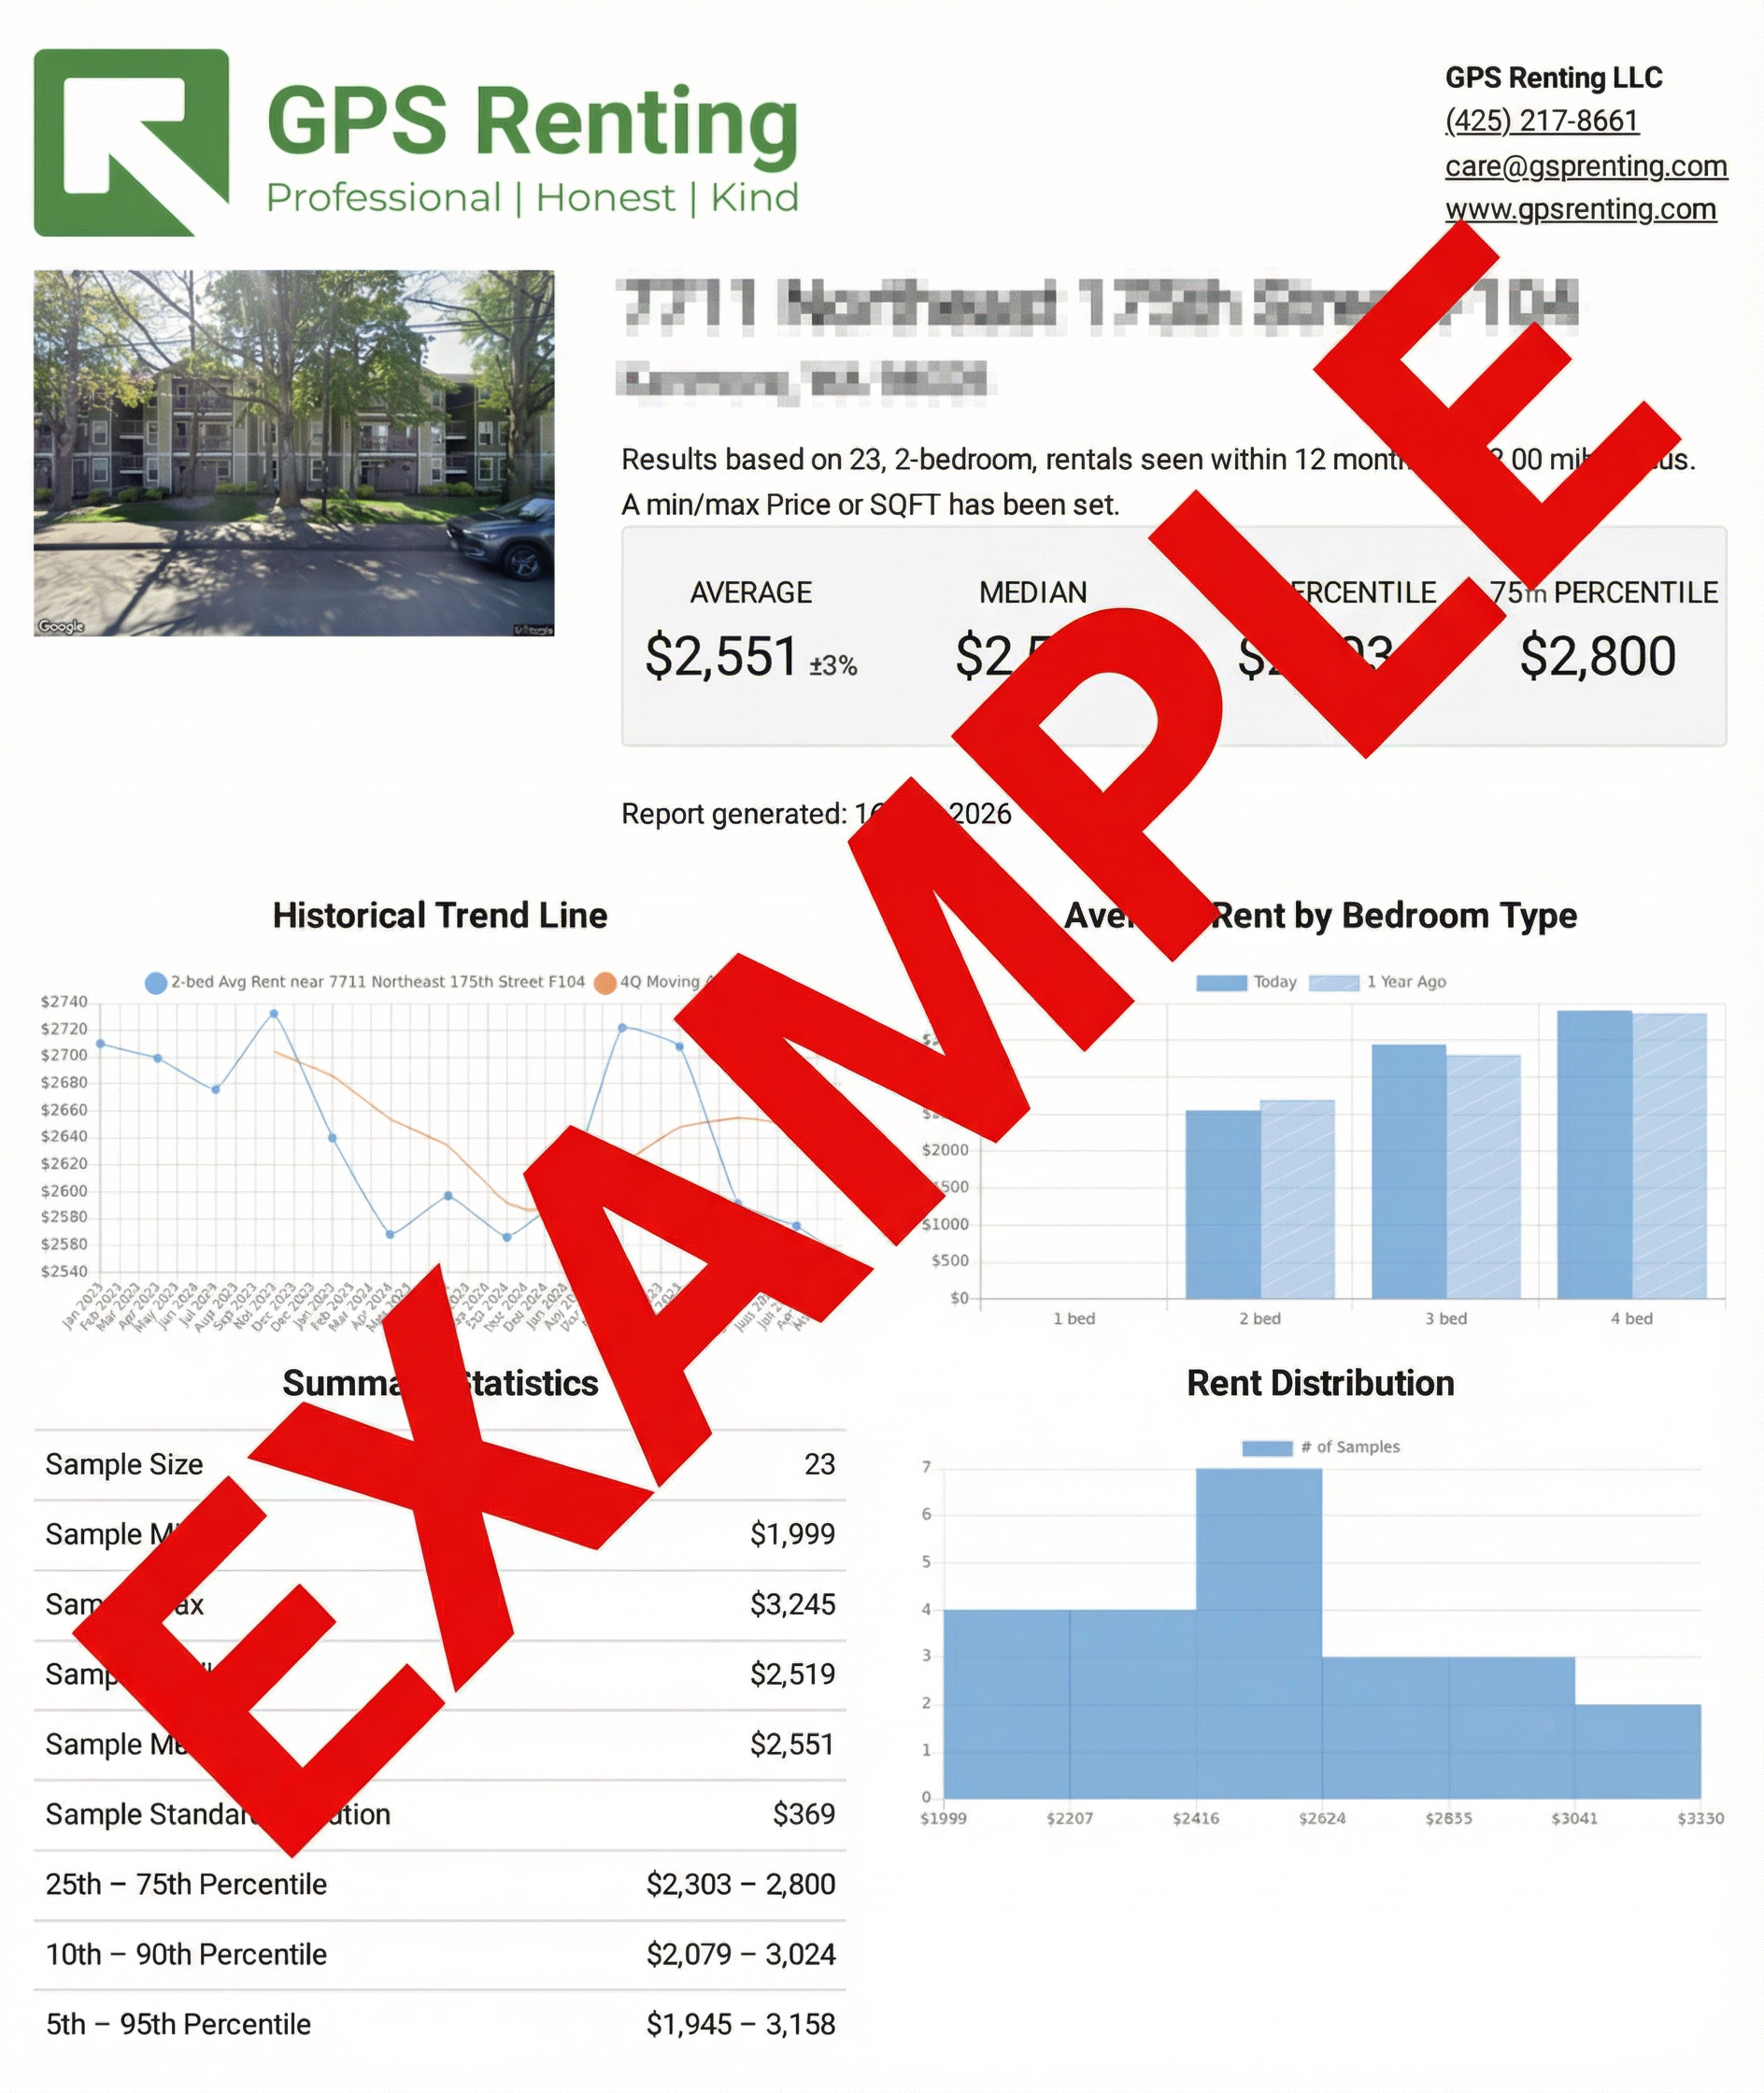
Click “Get Your Free Rental Analysis” to see:
- Detailed rent estimates for your specific property
- Historical rent trends and market data
- Comparable properties in your area
- Income projections and ROI analysis
- Professional recommendations from GPS Renting