
Flipping houses—buying a property, renovating it, and reselling—can be rewarding, but real results depend on where you buy, how well you budget, and how fast you execute. Below is a clear, data-driven view using 2024–2025 figures and a practical framework you can use before your next deal.
Thinking of flipping homes in Seattle but not sure where to start? GPS Renting helps real estate investors maximize returns while staying fully compliant with local laws.
Key Takeaway
Typical profits: Recent nationwide averages point to ~$65K–$73.5K gross profit per flip with ~25%–30% ROI before expenses (ATTOM Data).
Time to flip: Average timeline is ~166 days (about 5.5 months). Every extra month increases carrying costs and cuts into net profit.
Financing mix: Roughly 37% financed vs. 63% cash—cash helps speed, financing enables scale (but adds cost).
Seattle snapshot: As of September 2025, the average “real estate flipper” pay in Seattle is ~$98,776/year (~$47.49/hr), with top earners at ~$135K (ZipRecruiter).
Guardrails: Use the 70% Rule, pad rehab budgets, and set a realistic exit plan (list price, timeline, plan B).
What the Numbers Look Like in 2024–2025
Gross profit per flip: ~$65K (Q1 2025) to $73.5K (Q2 2024).
ROI: Roughly 25%–30% on average (varies widely by market and execution).
Timeline: ~166 days per flip on average.
Financing: About 37% of flips financed vs. 63% all-cash.
Seattle earnings: Average ~$98,776/year; 25th–75th percentile roughly $73,400–$113,800; top earners around $135,425 (ZipRecruiter).
Note: “Salary” metrics differ from deal profit. Salary reflects what a “flipper” role nets on average; deal profit is project-based and depends on how many flips you complete annually.
Related article: How Property Management Works in Seattle
Quick Math: Turning Gross Into Net
Example
Purchase price: $260,000
ARV: $325,000
Gross spread: $65,000
From that gross, subtract:
Renovations: materials, labor, permits, contingency
Holding: interest (if financed), insurance, taxes, utilities, HOA (if any)
Transaction: closing costs, title, staging, professional photos, agent/broker fees (if used)
A modest $35K–$45K all-in cost stack on a $65K gross can drop net into the $20K–$30K range. Conversely, scope creep, delays, or interest spikes can compress profits to low five figures—or worse.
Related article: Maximize Rental Property ROI: Strategic Upgrades
Flipping Scenario Estimates
Below is an example scenario table showing how net profit changes at different After Repair Values (ARV), repair levels, and financing approaches.
Assumptions:
Gross profit assumed at 20% of ARV
Repairs: Lean 15% / Typical 20% / Heavy 25% of ARV
Other costs: 5% (cash) or 8% (financed) of ARV
Net Profit Estimates by Scenario
| ARV | Repairs | Other Costs | Net Profit |
|---|---|---|---|
| $300,000 | Lean (15%) | Cash (5%) | $0 |
| $300,000 | Typical (20%) | Financed (8%) | -$34,000 |
| $400,000 | Typical (20%) | Financed (8%) | -$32,000 |
| $500,000 | Lean (15%) | Cash (5%) | $0 |
| $600,000 | Heavy (25%) | Financed (8%) | -$78,000 |
Visual Comparison (ARV $400K)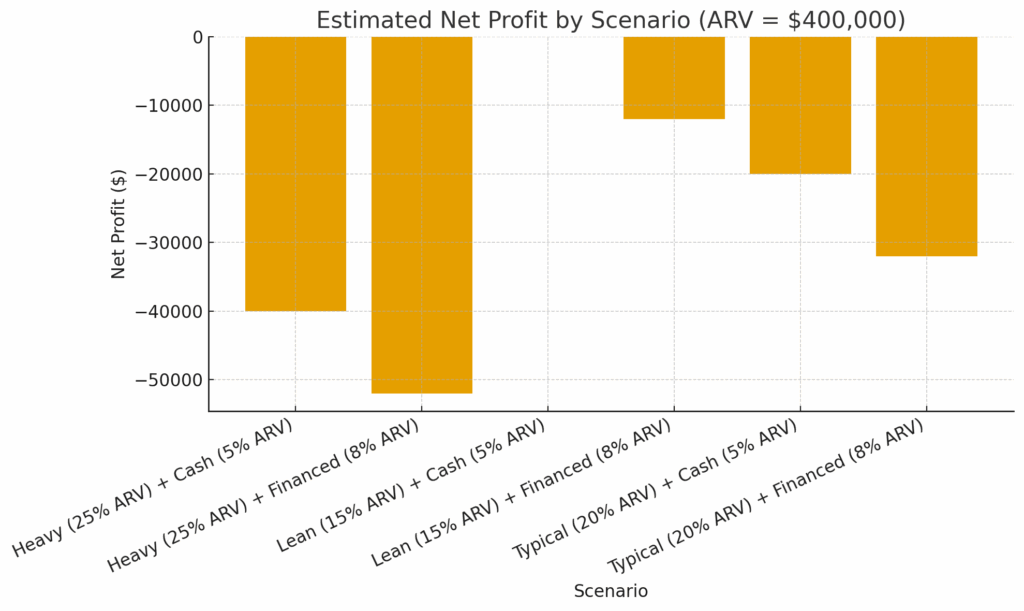
Annual Income Projection
| Flips per Year | Net per Flip | Annual Income |
|---|---|---|
| 1 | $-32,000 | $-32,000 |
| 3 | $-32,000 | $-96,000 |
| 5 | $-32,000 | $-160,000 |
Tip: Run your own math before you buy—if you’re not clearing at least $25K–$30K net per flip, the risk-to-reward ratio gets thin fast.
The 70% Rule (Use It as a Ceiling, Not a Target)
Maximum Offer ≈ (ARV × 70%) − Repairs
Example: ARV $325,000; Repairs $45,000 → Max Offer ≈ $182,500.
This keeps a buffer for carrying and selling costs and preserves profit if surprises pop up.
Related article: Seattle Landlord-Tenant Law Guide
Seattle Realities (2025)
Deal flow: Seattle’s flipping share of total sales sits on the lower end relative to some metros, meaning competition for viable deals is strong (Real Estate Skills).
Price points: Higher entry costs demand tight underwriting and fast, professional execution to hit ROI targets.
Pacing: With the ~166-day national average (ATTOM), scheduling reliability (trades, materials) is a profit lever.
Related article: Reduce Vacancy: Property Management Strategies
Where Property Management Fits for Flippers

Not every flip sells on schedule—and some properties pencil better as BRRRR or interim rentals. That’s where GPS Renting helps:
Rent-ready advisory & pricing guidance to stabilize quickly if you hold.
Tenant placement at $0 placement fee and no maintenance markups, so you keep more of the cash flow.
Compliance-first operations (Seattle + WA rules) to reduce risk while you prep your next acquisition.
Result: A viable Plan B that protects capital and buys time—without forcing a fire-sale.
Related article: Professional Property Management Services in Seattle
Bottom Line
In 2025, gross profits around $65K–$73K per flip are still common nationally, with average ROIs near 25%–30% and ~166 days to turn. Seattle offers strong resale fundamentals but tighter deal flow; winning here means buying right, budgeting conservatively, and moving fast. Add a rental fallback and you’ll preserve margin when timelines or rates wobble.
Related article: Real Estate Investment Guide: Seattle
Want a second set of eyes on your next Seattle flip—or a ready rental fallback to protect your returns? GPS Renting can help you run the numbers, prep rent-ready, and stabilize fast with no tenant placement fee and no maintenance markups. Let’s make your next project a win.